
The Four-Year Pattern
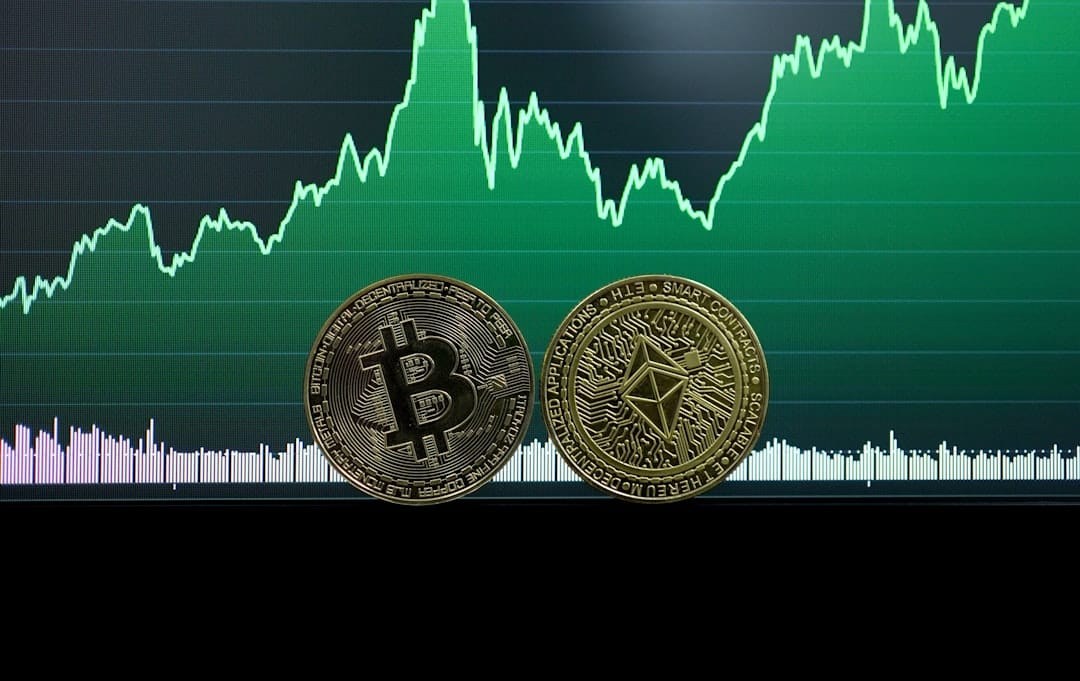
Bitcoin's price history is characterised by extreme volatility structured around recurring market cycles: multi-year periods of explosive appreciation followed by prolonged and severe drawdowns. These cycles have roughly corresponded with the Bitcoin halving schedule — occurring approximately every four years — though the relationship is correlational, not mechanistically proven.
Since Bitcoin's first meaningful market price in 2010, the following major cycles have occurred:
- 2011: Rise to ~$30, crash to ~$2 (93% drawdown)
- 2013: Two peaks, high ~$1,200, crash to ~$150 (88% drawdown)
- 2017–2018: Peak ~$20,000, crash to ~$3,200 (84% drawdown)
- 2020–2022: Peak ~$69,000, crash to ~$15,500 (78% drawdown)
- 2023–2024: Recovery and new all-time high above $100,000
Each cycle has brought a higher absolute price peak and attracted a new wave of institutional and retail participants.