
Reading Price Through Indicators
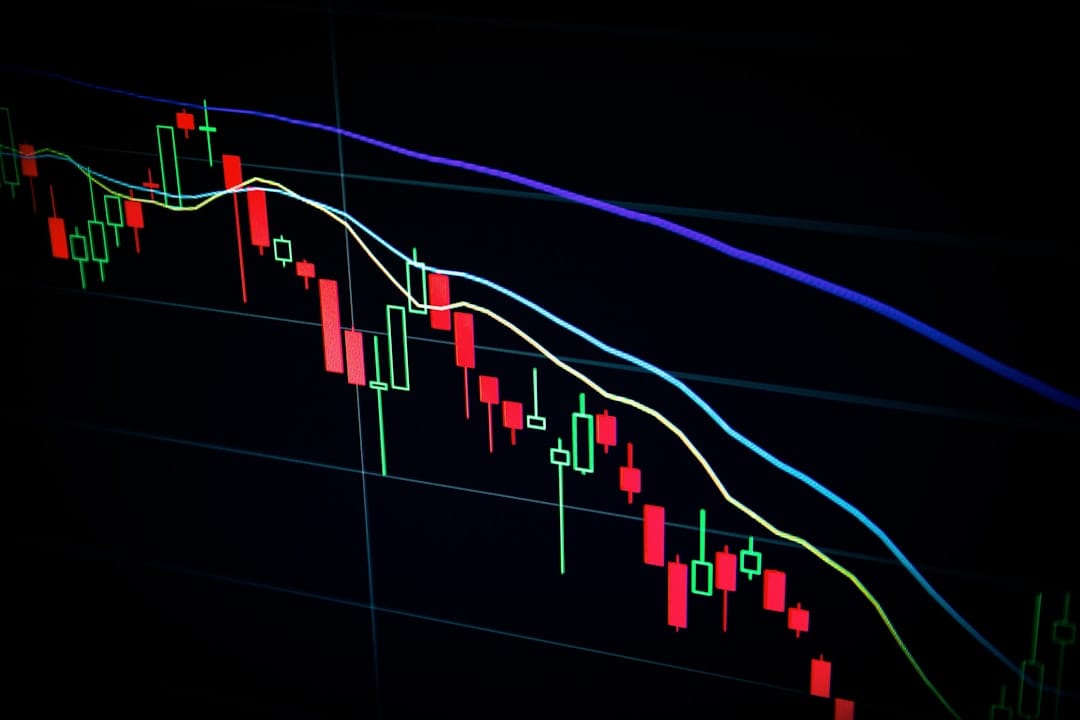
Technical indicators are mathematical calculations applied to price and volume data to help investors identify trends, momentum, and potential turning points. They are tools, not oracles. The academic evidence for any single indicator generating consistent excess returns on its own is weak — but indicators are widely used in practice as discipline tools: structuring decision-making, managing entry and exit timing, and providing a systematic framework for reading market conditions rather than reacting emotionally.
Understanding the most common indicators — their construction, their interpretation, and their limitations — is useful both for evaluating financial content you encounter and for making more deliberate decisions about when and how to act on a market view.