Finscape
Sign in
← Back to decks
Sign in to save your progress.Sign in

Common Technical Indicators

Technical indicators are mathematical calculations applied to price and volume data to help investors identify trends, momentum, and potential turning points. They are tools, not oracles. The academic evidence for any single indicator generating consistent excess returns on its own is weak — but…

10 cards
Study this deck

Common Technical Indicators

In this lesson · 6 sections
Step 6 of 6

The Caveat: Indicators as Discipline, Not Prediction
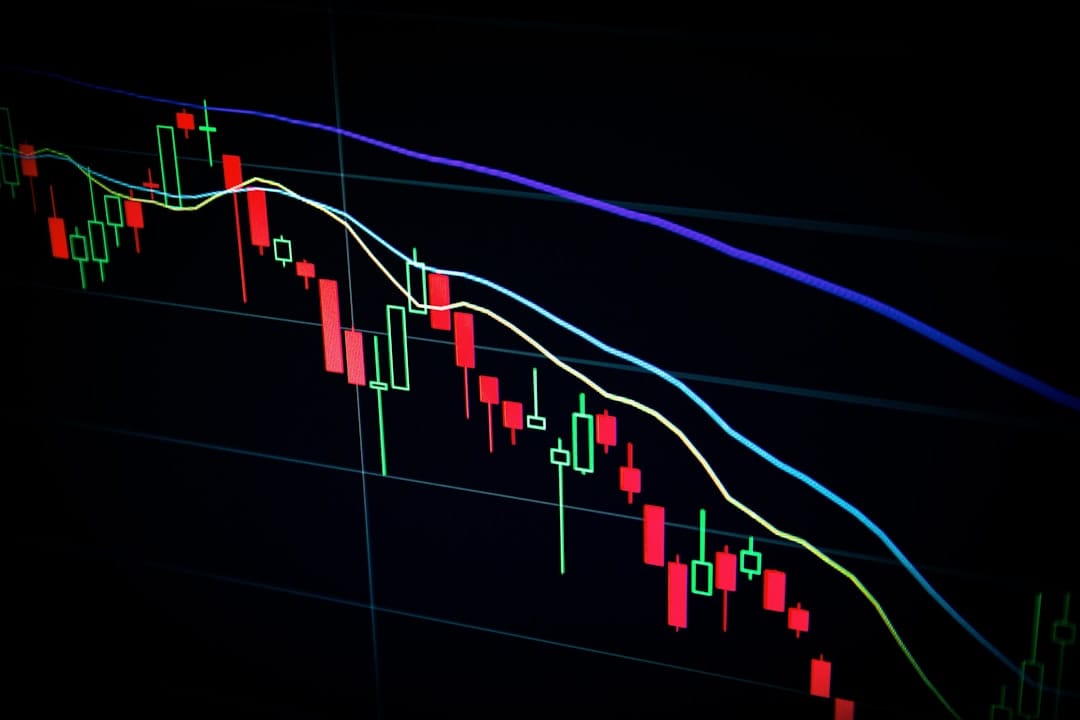
stock market candlestick chart on dark screen
Photo by Maxim Hopman on Unsplash

The critical limitation of technical indicators is well established in academic finance. Research consistently finds that no single indicator or combination of indicators generates statistically significant excess returns on a standalone basis after accounting for transaction costs and data-mining biases.

What indicators can do is impose discipline: providing structured criteria for entries, exits, and risk management that prevent purely emotional decision-making. A trader who only buys when RSI is below 40 and sells when it exceeds 70 is following a rule — and rules, even imperfect ones, tend to produce more consistent outcomes than impulse-driven decisions. This is the most defensible use of technical tools for most investors.

Educational content only. Not financial, investment, tax or legal advice. Learn more

Quiz me on this
Simple moving average (SMA)
Save
Exponential moving average (EMA)
Save
Golden cross and death cross
Save
Relative Strength Index (RSI)
Save
MACD
Save
Bollinger Bands
Save